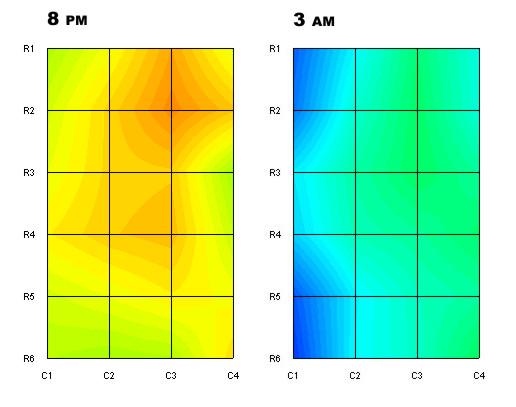


DyMap shows the changes of temperature (or other physical quantity), across an area and over time, in a colour map movie form (Dynamic mapping).
The T-TEC DyMap program can combine measurements from a number of carefully placed dataloggers, to create a movie of temperatures. Data from iButton Thermochron temperature dataloggers, T-TEC data loggers or other loggers where the files are compatible may be used.
T-TEC or Thermochron data loggers are placed in a network, in rows and columns and layers, with their positions coded in the comments field of the logger file, for example, as 'R1C2L1'. Once the T-TEC data loggers are read by the T-TEC software, the files are stored on the computer. DyMap can combine the measurements from all the dataloggers and show them as a form of movie. The readings may be from a store room, cool room, greenhouse, church, freezer, refrigerator, anywhere the temperature control is important. The movie is seen as though the viewer were overlooking the area for the duration. In 3 dimensional views the user can choose to see rows, columns or layers individually.
The DyMap program can create reports in a 'read only' format so the results can be presented easily in a very professional CD presentation. Such a report from the above example can be downloaded here in a .zip format, along with the manual, help file and full explanation of the 'Read Only' program.

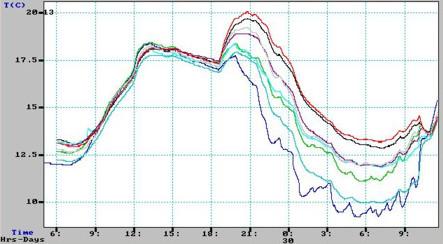
Data from the top 8 data loggers (Rows R1 and R2) in the room, for the whole duration of the test, graphed in T-TEC software.
For example, 26 T-TEC dataloggers were used to measure a room. 24 of the data loggers were placed in a 6x4 meter network on the floor (at 1 meter intervals) of the room and the last two dataloggers measured outside temperatures. S1 on the eastern side and S2 on the western side. The data from each datalogger was downloaded to the computer.\

The test area is an upstairs room with a staircase at the upper right corner, leading to the lower floor. The left side (West) and most of the south and north sides are glass. The room is unoccupied during the day. In the evening, a heater is switched on downstairs and a small fan heater in the room itself. Both heaters are switched off later.